Results plotting#
This module uses the georges-core’s plotting module . It can uses the Matplotlib ot the Plotly library as backend.
Example:
import matplotlib.pyplot as plt
plt.rc('text', usetex=False)
fig = plt.figure(figsize=(20,8))
ax = fig.add_subplot(111)
manzoni_plot = vis.ManzoniMatplotlibArtist(ax=ax)
manzoni_plot.plot_cartouche(sequence.df) # Preparation of the plot
manzoni_plot.plot_beamline(sequence.df, print_label=False, with_aperture=False, plane='X')
If an observer has been used in the simulation, the results can be added to the previous figure depending the instance of the observer:
Type of observers#
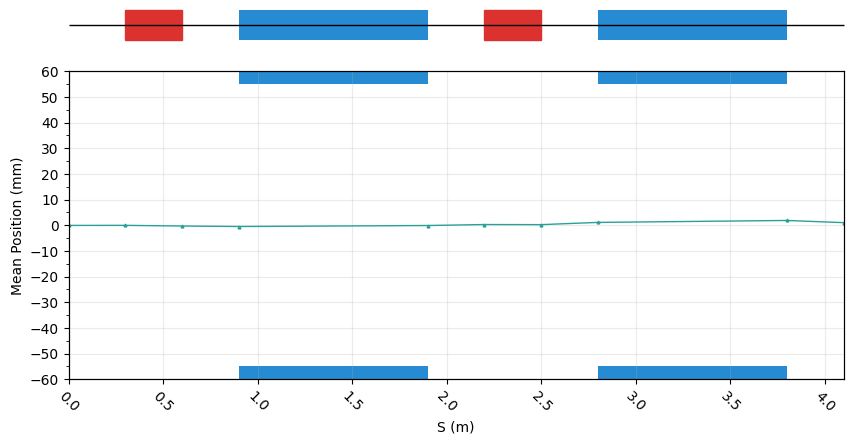
Mean Observer#
fig = plt.figure(figsize=(10,4))
ax = fig.add_subplot(111)
manzoni_plot = vis.ManzoniMatplotlibArtist(ax=ax)
manzoni_plot.plot_cartouche(sequence.df)
manzoni_plot.plot_beamline(sequence.df, print_label=False, with_aperture=True, plane='X')
manzoni_plot.tracking(beam_observer_mean, plane='X')
manzoni_plot = vis.ManzoniPlotlyArtist(width=600, height=400)
manzoni_plot.fig["layout"]["margin"] = dict(l=0, r=0, b=0)
manzoni_plot.fig['layout']['legend'] = dict(yanchor="top",
                                            y=0.99,
                                            xanchor="left",
                                            x=0.01)
manzoni_plot.plot_cartouche(sequence.df, unsplit_bends=False, vertical_position=1.15)
manzoni_plot.tracking(beam_observer_mean, plane='X')
manzoni_plot.fig['data'][0]['showlegend'] = True
manzoni_plot.render()
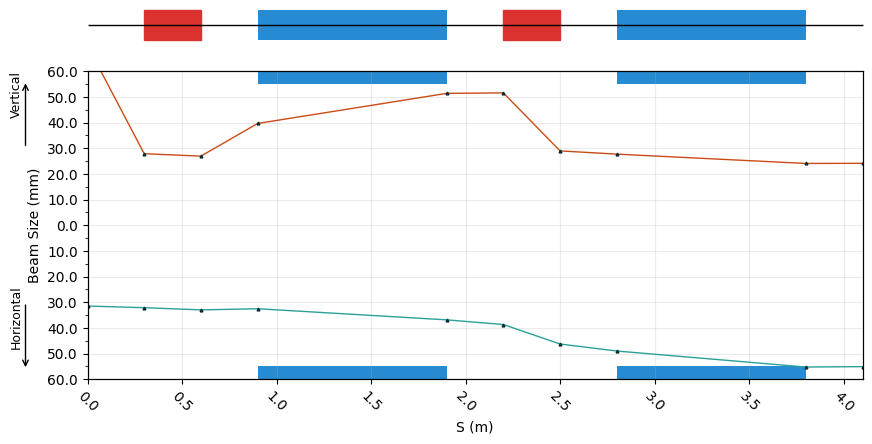
Std Observer#
fig = plt.figure(figsize=(10,4))
ax = fig.add_subplot(111)
manzoni_plot = vis.ManzoniMatplotlibArtist(ax=ax)
manzoni_plot.plot_cartouche(sequence.df)
manzoni_plot.plot_beamline(sequence.df, print_label=False, with_aperture=True, plane='X')
manzoni_plot.tracking(beam_observer_std, plane='both')
manzoni_plot = vis.ManzoniPlotlyArtist(width=600, height=400)
manzoni_plot.fig["layout"]["margin"] = dict(l=0, r=0, b=0)
manzoni_plot.fig['layout']['legend'] = dict(yanchor="top",
                                            y=0.99,
                                            xanchor="left",
                                            x=0.01)
manzoni_plot.plot_cartouche(sequence.df, unsplit_bends=False, vertical_position=1.15)
manzoni_plot.tracking(beam_observer_std, plane='both')
manzoni_plot.fig['data'][0]['showlegend'] = True
manzoni_plot.fig['data'][1]['showlegend'] = True
manzoni_plot.render()
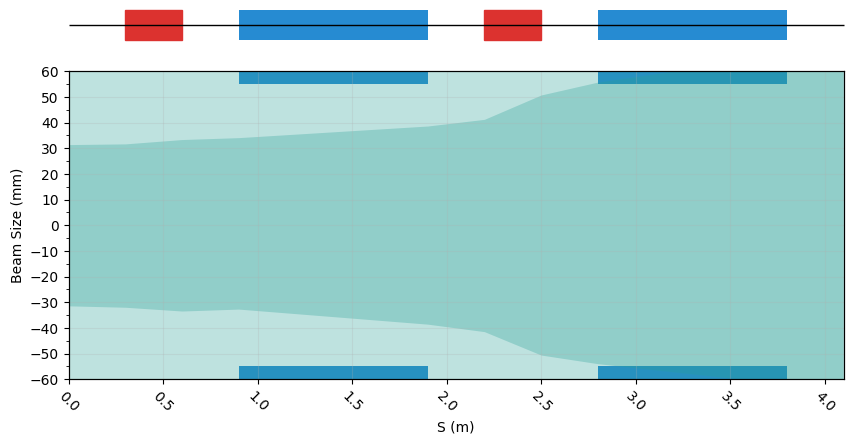
Beam Observer#
fig = plt.figure(figsize=(10,4))
ax = fig.add_subplot(111)
manzoni_plot = vis.ManzoniMatplotlibArtist(ax=ax)
manzoni_plot.plot_cartouche(sequence.df)
manzoni_plot.plot_beamline(sequence.df, print_label=False, with_aperture=True, plane='X')
manzoni_plot.tracking(beam_observer_beam, fill_between=False, plane='X', mean=False, std=False, halo=True)
manzoni_plot = vis.ManzoniPlotlyArtist(width=600, height=400)
manzoni_plot.fig["layout"]["margin"] = dict(l=0, r=0, b=0)
manzoni_plot.fig['layout']['legend'] = dict(yanchor="top",
                                            y=0.99,
                                            xanchor="left",
                                            x=0.01)
manzoni_plot.plot_cartouche(sequence.df, unsplit_bends=False, vertical_position=1.15)
manzoni_plot.tracking(beam_observer_beam, fill_between=False, plane='X', mean=False, std=False, halo=True)
manzoni_plot.fig['data'][0]['showlegend'] = True
manzoni_plot.render()
Phase Space Observer#
fig = plt.figure(figsize=(10,4))
ax = fig.add_subplot(111)
manzoni_plot = vis.ManzoniMatplotlibArtist(ax=ax)
manzoni_plot.plot_cartouche(sequence.df)
manzoni_plot.phase_space(observer=beam_observer_beam,
                         element='Q1',
                         dim=['X', 'PX'],
                         location='OUT',
                         nbins=[51, 51])
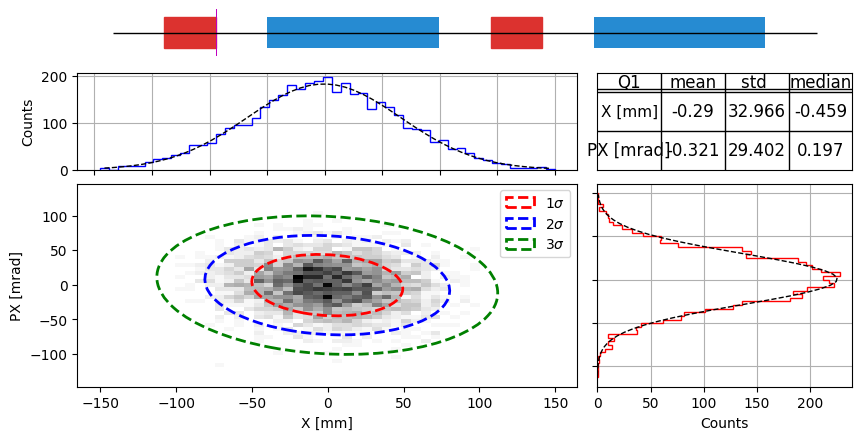
Warning
This method is not yet implemented.
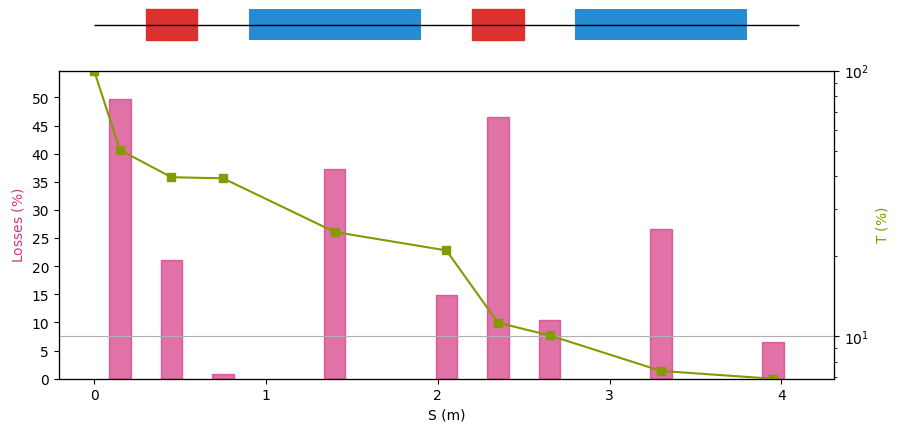
Losses Observer#
fig = plt.figure(figsize=(10,4))
ax = fig.add_subplot(111)
manzoni_plot = vis.ManzoniMatplotlibArtist(ax=ax)
manzoni_plot.plot_cartouche(sequence.df) # Preparation of the plot
manzoni_plot.losses(beam_observer_losses, log_scale=True)
manzoni_plot = vis.ManzoniPlotlyArtist(width=600, height=400)
manzoni_plot.fig["layout"]["margin"] = dict(l=0, r=0, b=0)
manzoni_plot.fig['layout']['legend'] = dict(yanchor="top",
                                            y=0.99,
                                            xanchor="left",
                                            x=0.01)
manzoni_plot.plot_cartouche(sequence.df, unsplit_bends=False, vertical_position=1.15)
manzoni_plot.losses(beam_observer_losses, log_scale=True)
manzoni_plot.render()
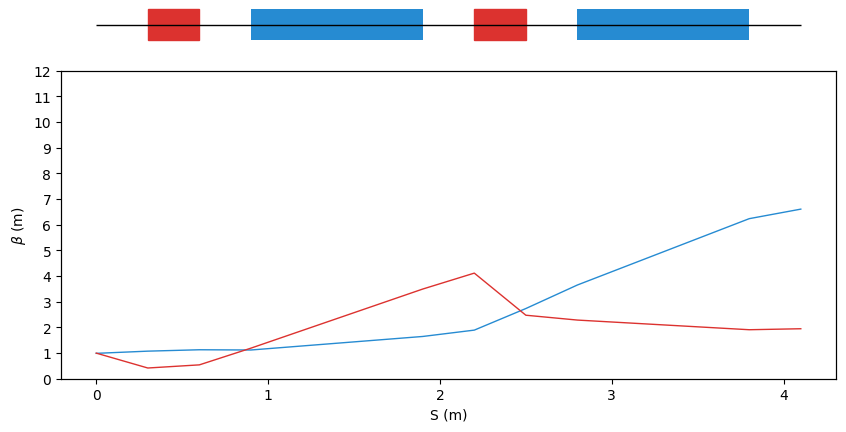
Twiss Observer#
fig = plt.figure(figsize=(10,4))
ax = fig.add_subplot(111)
manzoni_plot = vis.ManzoniMatplotlibArtist(ax=ax)
manzoni_plot.plot_cartouche(sequence.df)
manzoni_plot.twiss(beam_observer_tw, with_beta=True, with_alpha=False, with_dispersion=False)
manzoni_plot = vis.ManzoniPlotlyArtist(width=600, height=400)
manzoni_plot.fig["layout"]["margin"] = dict(l=0, r=0, b=0)
manzoni_plot.fig['layout']['legend'] = dict(yanchor="top",
                                            y=0.99,
                                            xanchor="left",
                                            x=0.01)
manzoni_plot.plot_cartouche(sequence.df, unsplit_bends=False, vertical_position=1.15)
manzoni_plot.twiss(beam_observer_tw, with_beta=True, with_alpha=False, with_dispersion=False)
manzoni_plot.fig['data'][0]['showlegend'] = True
manzoni_plot.render()
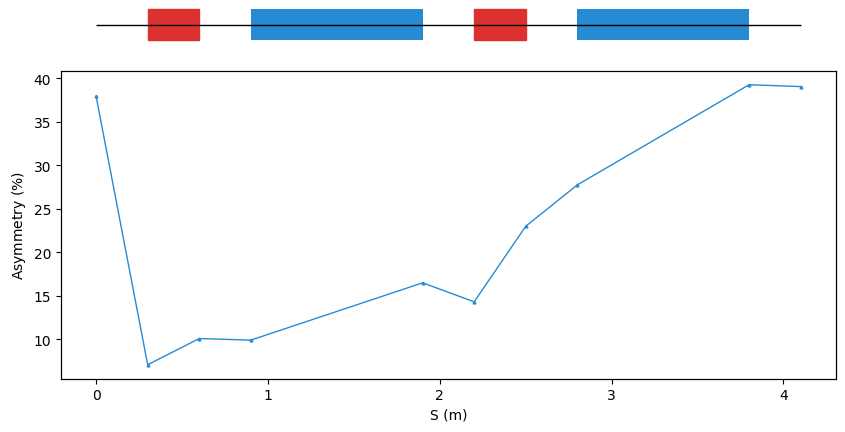
Symmetry Observer#
fig = plt.figure(figsize=(10,4))
ax = fig.add_subplot(111)
manzoni_plot = vis.ManzoniMatplotlibArtist(ax=ax)
manzoni_plot.plot_cartouche(sequence.df)
manzoni_plot.symmetry(observer=symmetry_observer)
Warning
This method is not yet implemented.
API#
|
A matplotlib implementation of a Matplotlib artist. |
|
A plotly implementation of a Plotly artist. |