Validation with MAD_X#
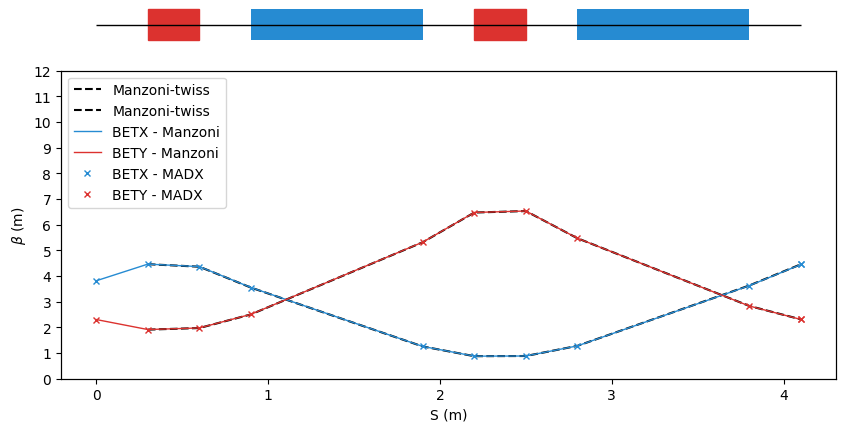
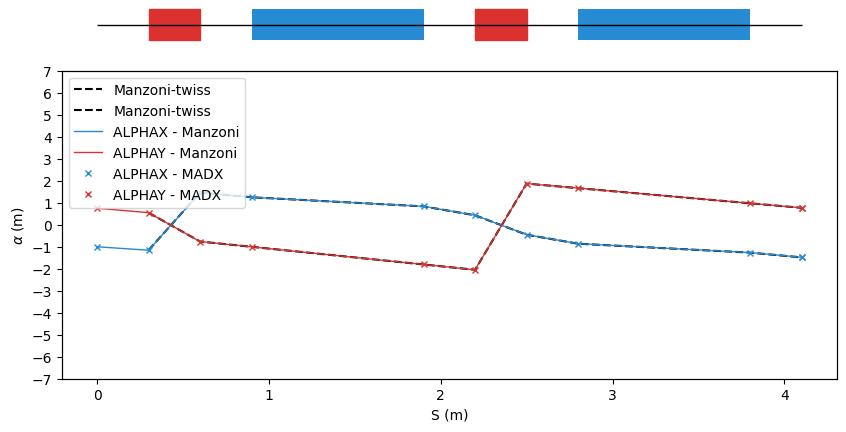
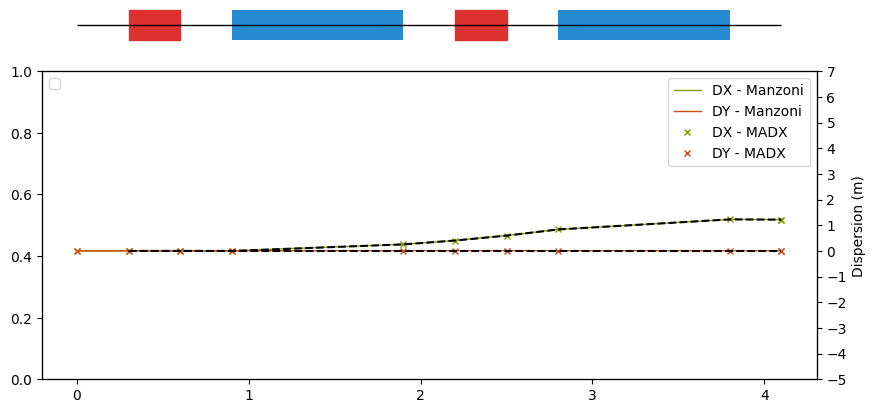
The Manzoni tracking code can be validated against MAD-X using the converters described in georges-core. The example here below illustrates how to define a line, then use MAD-X and finally compare the results with Manzoni.
 import matplotlib.pyplot as plt
 import georges
 from georges import BetaBlock
 from georges.manzoni import Input
 from georges.manzoni.beam import MadXBeam
 from georges.manzoni import observers
 from georges import vis
 _ureg = georges.ureg
We define the kinematics and the beam properties for the line#
 kin = georges.Kinematics(230 *_ureg.MeV,
                      particle=georges.particles.Proton,
                      kinetic=True)
 betax = 3.81481846*_ureg.m
 betay = 2.30182336*_ureg.m

 alfax = -1
 alfay = 0.75
Let’s define a line with drifts, quadrupoles and dipoles#
 d1 = georges.Element.Drift(NAME="D1",
                        L=0.3* _ureg.m,
                        APERTYPE="RECTANGULAR",
                        APERTURE=[10*_ureg.cm, 5*_ureg.cm])

 qf = georges.Element.Quadrupole(NAME="Q1",
                                 L=0.3*_ureg.m,
                                 K1=2*_ureg.m**-2,
                                 APERTYPE="RECTANGULAR",
                                 APERTURE=[10*_ureg.cm, 5*_ureg.cm])

 d2 = georges.Element.Drift(NAME="D2",
                            L=0.3*_ureg.m,
                            APERTYPE="CIRCULAR",
                            APERTURE=[10*_ureg.cm, 10*_ureg.cm])

 b1 = georges.Element.SBend(NAME="B1",
                            L=1*_ureg.m,
                            ANGLE=30*_ureg.degrees,
                            K1=0*_ureg.m**-2,
                            APERTYPE="CIRCULAR",
                            APERTURE=[10*_ureg.cm, 10*_ureg.cm])

 d3 = georges.Element.Drift(NAME="D3",
                            L=0.3*_ureg.m,
                            APERTYPE="CIRCULAR",
                            APERTURE=[10*_ureg.cm, 10*_ureg.cm])

 qd = georges.Element.Quadrupole(NAME="Q2",
                                 L=0.3*_ureg.m,
                                 K1=-2*_ureg.m**-2,
                                 APERTYPE="RECTANGULAR",
                                 APERTURE=[10*_ureg.cm, 5*_ureg.cm])

 d4 = georges.Element.Drift(NAME="D4",
                            L=0.3*_ureg.m,
                            APERTYPE="CIRCULAR",
                            APERTURE=[10*_ureg.cm, 10*_ureg.cm])

 b2 = georges.Element.SBend(NAME="B2",
                            L=1*_ureg.m,
                            ANGLE=-30*_ureg.degrees,
                            K1=0*_ureg.m**-2,
                            APERTYPE="RECTANGULAR",
                            APERTURE=[10*_ureg.cm, 5*_ureg.cm])

 d5 = georges.Element.Drift(NAME="D5",
                            L=0.3*_ureg.m,
                            APERTYPE="CIRCULAR",
                            APERTURE=[10*_ureg.cm, 10*_ureg.cm])

 sequence = georges.sequence.PlacementSequence(name="fodo")

 sequence.place(d1,at_entry=0*_ureg.m)
 sequence.place_after_last(qf)
 sequence.place_after_last(d2)
 sequence.place_after_last(b1)
 sequence.place_after_last(d3)
 sequence.place_after_last(qd)
 sequence.place_after_last(d4)
 sequence.place_after_last(b2)
 sequence.place_after_last(d5)

 sequence.metadata.kinematics = kin
 mad_input = georges.madx.MadX(sequence=sequence);
 tfs_data = mad_input.twiss(sequence='fodo',
                            betx=betax.m_as('m'),
                            bety=betay.m_as('m'),
                            alfx=alfax,
                            alfy=alfay);
 beam = MadXBeam(kinematics=kin,
         distribution=georges.Distribution.from_twiss_parameters(n=100000,
                                        betax=betax,
                                        betay=betay,
                                        alphax=alfax,
                                        alphay=alfay,
                                        dpprms=1e-3).distribution.values
        )
Two methods are available to validate the Twiss functions#
- If you want a validation of the line with
MAD-X, there is two possibilities: Use a TwissObserver
Use Manzoni.twiss() to compute the Twiss functions along the line
 mi = Input.from_sequence(sequence=sequence)
 beam_observer_tw = mi.track(beam=beam, observers=observers.TwissObserver())
 manzoni_twiss = mi.twiss(kinematics=kin, twiss_init=BetaBlock(BETA11=betax,
                                                               ALPHA11=alfax,
                                                               BETA22=betay,
                                                               ALPHA22=alfay))
Compare results between MAD-X and Manzoni#
fig = plt.figure(figsize=(10,4))
ax = fig.add_subplot(111)
manzoni_plot = vis.ManzoniMatplotlibArtist(ax=ax)
manzoni_plot.plot_cartouche(sequence.df) # Preparation of the plot
manzoni_plot.ax.plot(manzoni_twiss['S'], manzoni_twiss['BETA11'], label='Manzoni-twiss', ls='--', color='k')
manzoni_plot.ax.plot(manzoni_twiss['S'], manzoni_twiss['BETA22'], label='Manzoni-twiss', ls='--', color='k')
manzoni_plot.twiss(beam_observer_tw, with_dispersion = False, tfs_data=tfs_data)
ax.legend(loc='upper left')
<matplotlib.legend.Legend at 0x7f89e8558fd0>

fig = plt.figure(figsize=(10,4))
ax = fig.add_subplot(111)
manzoni_plot = vis.ManzoniMatplotlibArtist(ax=ax)
manzoni_plot.plot_cartouche(sequence.df) # Preparation of the plot
manzoni_plot.ax.plot(manzoni_twiss['S'], manzoni_twiss['ALPHA11'], label='Manzoni-twiss', ls='--', color='k')
manzoni_plot.ax.plot(manzoni_twiss['S'], manzoni_twiss['ALPHA22'], label='Manzoni-twiss', ls='--', color='k')
manzoni_plot.twiss(beam_observer_tw, with_beta=False, with_alpha=True, with_dispersion = False, tfs_data=tfs_data)
ax.legend(loc='upper left')
<matplotlib.legend.Legend at 0x7f89e84d80d0>

fig = plt.figure(figsize=(10,4))
ax = fig.add_subplot(111)
manzoni_plot = vis.ManzoniMatplotlibArtist(ax=ax)
manzoni_plot.plot_cartouche(sequence.df) # Preparation of the plot
manzoni_plot.twiss(beam_observer_tw, with_beta=False, with_alpha=False, with_dispersion = True, tfs_data=tfs_data, relativistic_beta=kin.beta)
manzoni_plot.ax_disp.plot(manzoni_twiss['S'], manzoni_twiss['DISP1'], label='Manzoni-twiss', ls='--', color='k')
manzoni_plot.ax_disp.plot(manzoni_twiss['S'], manzoni_twiss['DISP3'], label='Manzoni-twiss', ls='--', color='k')
ax.legend(loc='upper left')
<matplotlib.legend.Legend at 0x7f89e84efa90>

manzoni_plot = vis.ManzoniPlotlyArtist(width=600, height=400)
manzoni_plot.fig["layout"]["margin"] = dict(l=0, r=0, b=0)
manzoni_plot.fig['layout']['legend'] =dict(
    yanchor="top",
    y=0.99,
    xanchor="left",
    x=0.01
)
manzoni_plot.plot_cartouche(sequence.df, unsplit_bends=False, vertical_position=1.12)
manzoni_plot.twiss(beam_observer_tw, with_beta=True, tfs_data=tfs_data)
manzoni_plot.scatter(x=manzoni_twiss['S'],
     y=manzoni_twiss['BETA11'],
     name='Manzoni_twiss',
     mode='lines',
     line={'dash': 'dash', 'color': 'black'})
manzoni_plot.scatter(x=manzoni_twiss['S'],
     y=manzoni_twiss['BETA22'],
     name='Manzoni_twiss',
     showlegend=False,
     line={'dash': 'dash', 'color': 'black'})
manzoni_plot.fig['data'][0]['showlegend'] = True
manzoni_plot.fig['data'][1]['showlegend'] = True
manzoni_plot.fig['data'][1]['showlegend'] = True
manzoni_plot.render()
manzoni_plot = vis.ManzoniPlotlyArtist(width=600, height=400)
manzoni_plot.fig["layout"]["margin"] = dict(l=0, r=0, b=0)
manzoni_plot.fig['layout']['legend'] =dict(
    yanchor="top",
    y=0.99,
    xanchor="left",
    x=0.01
)
manzoni_plot.scatter(x=manzoni_twiss['S'],
     y=manzoni_twiss['ALPHA11'],
     name='Manzoni_twiss',
     mode='lines',
     line={'dash': 'dash', 'color': 'black'})
manzoni_plot.scatter(x=manzoni_twiss['S'],
     y=manzoni_twiss['ALPHA22'],
     name='Manzoni_twiss',
     showlegend=False,
     line={'dash': 'dash', 'color': 'black'})
manzoni_plot.plot_cartouche(sequence.df, unsplit_bends=False, vertical_position=1.12)
manzoni_plot.twiss(beam_observer_tw, with_beta=False, with_alpha=True, tfs_data=tfs_data)
manzoni_plot.fig['data'][0]['showlegend'] = True
manzoni_plot.fig['data'][1]['showlegend'] = True
manzoni_plot.fig['data'][1]['showlegend'] = True
manzoni_plot.render()
manzoni_plot = vis.ManzoniPlotlyArtist(width=600, height=400)
manzoni_plot.fig["layout"]["margin"] = dict(l=0, r=0, b=0)
manzoni_plot.fig['layout']['legend'] =dict(
    yanchor="top",
    y=0.99,
    xanchor="left",
    x=0.01
)
manzoni_plot.scatter(x=manzoni_twiss['S'],
     y=manzoni_twiss['DISP1'],
     name='Manzoni_twiss',
     mode='lines',
     line={'dash': 'dash', 'color': 'black'})
manzoni_plot.scatter(x=manzoni_twiss['S'],
     y=manzoni_twiss['DISP3'],
     name='Manzoni_twiss',
     mode='lines',
     showlegend=False,
     line={'dash': 'dash', 'color': 'black'})
manzoni_plot.plot_cartouche(sequence.df, unsplit_bends=False, vertical_position=1.12)
manzoni_plot.twiss(beam_observer_tw, with_beta=False, with_alpha=False, with_dispersion=True ,tfs_data=tfs_data, relativistic_beta=kin.beta)
manzoni_plot.fig['data'][0]['showlegend'] = True
manzoni_plot.fig['data'][1]['showlegend'] = True
manzoni_plot.fig['data'][1]['showlegend'] = True
manzoni_plot.render()